
|
| Volleyball (Simulations) |

12 points
This program simulates a volleyball game. The basic input to the game is the probability (between 0 and 1) that a team will score a point when they are serving. The simulation tries to answer questions like, "If Team A has 0.6 probability of scoring when they serve, and Team B has 0.5 probability, how likely is it that Team A will win a particular game?"
Here you simulate playing one game. You write the method play1Game() to do this. In these simulations, Team A has probability of 0.5 or higher of winning a point when serving. The probability of Team B winning a point when serving is always 0.5. Each time a point is scored, an update is printed out. Output will look similar to this:
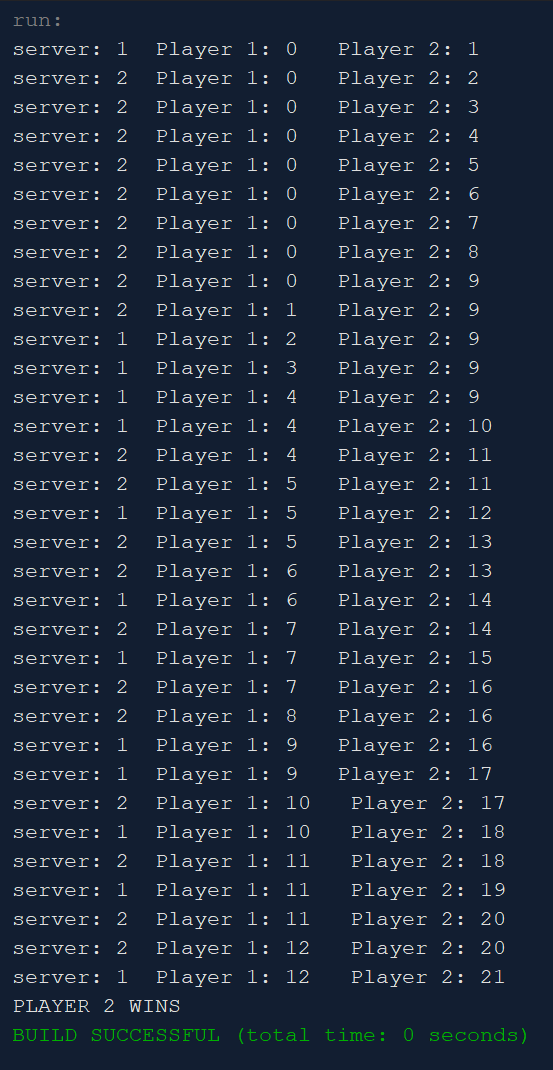
In the example above, both teams had a 0.5 probability of winning the serve. Instructions on writing play1Game() are given in the Java file.
Here you simulate running a large number of volleyball games. You write the method playManyGames(), and in it you call play1Game() repeatedly. The point is to address the question, "What's the connection between the advantage that Team A has and the probability that Team A wins a particular game?" (Team B always has a 0.5 probability of winning its serve.) For example, if Team A has a 0.6 probability of winning the point when it serves (giving it a 0.1 probability advantage), what is the probability that it wins a particular game? If Team A has a 0.7 probability of winning the point when it serves, what is the probability that it wins a particular game? You can answer these questions by setting Team A's probability of winning and then simulating many games.
Modify play1Game() so that, when a team wins a game, the team's 'gamesWon' variable is incremented.
One change here is that you will no longer print anything out from the individual games. The output would be enormous and it would slow down the running of the simulation.
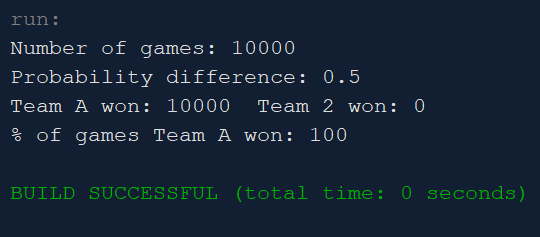
What you want to print out is the number of games simulated, the probability advantage that Team A has, the number of games each of the two teams win, and then the probability that Team A wins a given game.
An extreme example is if Team A wins 100% of its serves, which means it has a probability advantage of 0.5. Output will look similar to this:
Here you simulate running a large number of volleyball games, for a large number of different probability advantages that Team A can have over Team B. This probability for Team A is flexible. In the method playManyGamesManyTimes() you allow Team A's probability of winning the serve to vary from 0.5 to 1.0, growing by 0.01. In other words, you run simulations in which Team A's probability of winning the serve is 0.50, 0.51, 0.52, 0.53, etc.
You will have to comment out some code in playManyGames(). Some of this code you can copy into playManyGamesManyTimes(). Also, early in playManyGames() reset 'gamesWon' to 0 for each team.
Set up a loop in main() that allows Team A's probability of winning the serve to vary from 0.5 to 1.0. playManyGamesMany times() accepts two parameters, the Team A probability and how many games you will simulate.
Output from this method is again different. You will want to write out to a file, not to the screen. You want two columns of output: the probability advantage that Team A has and the probability that it wins a given game. There will be 50 rows of this output, as the Team A probability varies from 0.5 to 1.0. With one run of the program, the first line of this output file was: 0 50.01 (I expressed the probability of winning as a percent.)
At the end of main(), call 'vg.closeFile()' to close the output file.
Once you have the results, make a graph in Excel with column 1 on the x-axis and column 2 on the y-axis. To do this, in Excel: Data > Get External Data > From Text > browse to your output file > Delimited > Next > Space > Next > General > Finish. To make the graph: select your data, then Insert > click on an XY chart. The x-axis should go from 0 to 0.5 and the y-axis should go from 0 to 100 (if you express the probability as a percent). Use Chart Tools > Design > Add Chart Element to customize your graph.
Download VolleyballGame.java and VolleyballPlayer.java as a starting point.